

25 most unaffordable U.S. metros for renters

Photo Credit: Pete Niesen / Alamy Stock Photo
With rental prices skyrocketing and real wages remaining stagnant, renters across the country are allocating a higher percentage of their spending to housing costs. There are currently over 42 million renter households in the U.S. (36 percent of total households), which represents the highest percentage of renters in more than 50 years. Additionally, many of these renters are categorized as low-income, which has significant implications for urban policy and housing development on a larger scale. Not surprisingly, the issue of affordable housing has become increasingly prominent over the past few years.
According to the Department of Housing and Urban Development (HUD), affordable housing is defined as a living space (including utilities) for which the householder spends no more than 30 percent of his or her income. Any percentage higher than this amount puts a significant financial burden on the renter and increases the risk that the person will not be able to make payments on time or will not be able to afford other necessities such as food or healthcare. A 2017 report by the Federal Reserve states that renters in the bottom 20 percent of the income distribution spend more than half of their monthly income on rent, and that the amount of income this group spends on rent has increased 10 percentage points since 2000. After paying rent, the typical renter in this group has less than $500 per month left over for other basic expenses.
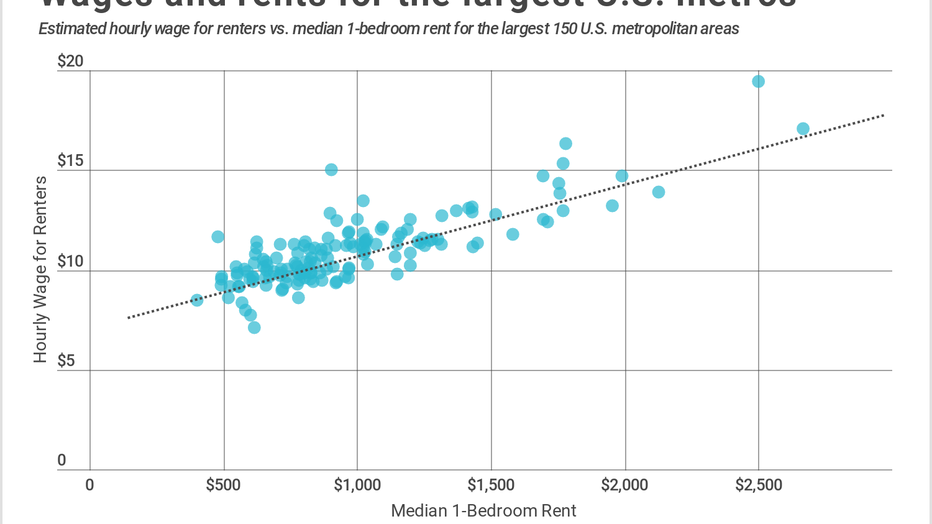
While housing affordability is a nationwide problem, the “renter wage gap” in some parts of the country is worse than in others. Using data from the U.S. Census Bureau, the U.S. Bureau of Labor Statistics, and Zillow, Credit Sesame looked at the largest 150 metropolitan areas to determine the largest gap between renters’ actual wages and the wages they would need to make in order to afford the median rent for a 1-bedroom apartment.
Takeaways
Below are the 25 most unaffordable metros for renters. Full results for the largest 150 metropolitan areas can be found on Credit Sesame.
The 25 most unaffordable metros for renters

Photo Credit: Bradley Sauter / Alamy Stock Photo
25. Fort Collins, CO

Photo Credit: Sean Pavone / Alamy Stock Photo
24. Philadelphia-Camden-Wilmington, PA-NJ-DE-MD

Photo Credit: Zoonar GmbH / Alamy Stock Photo
23. Minneapolis-St. Paul-Bloomington, MN-WI

Photo Credit: Sean Pavone / Alamy Stock Photo
22. Portland-South Portland, ME

Photo Credit: Daniil Belyay / Alamy Stock Photo
21. Salinas, CA

Photo Credit: Steve Minkler / Alamy Stock Photo
20. Riverside-San Bernardino-Ontario, CA
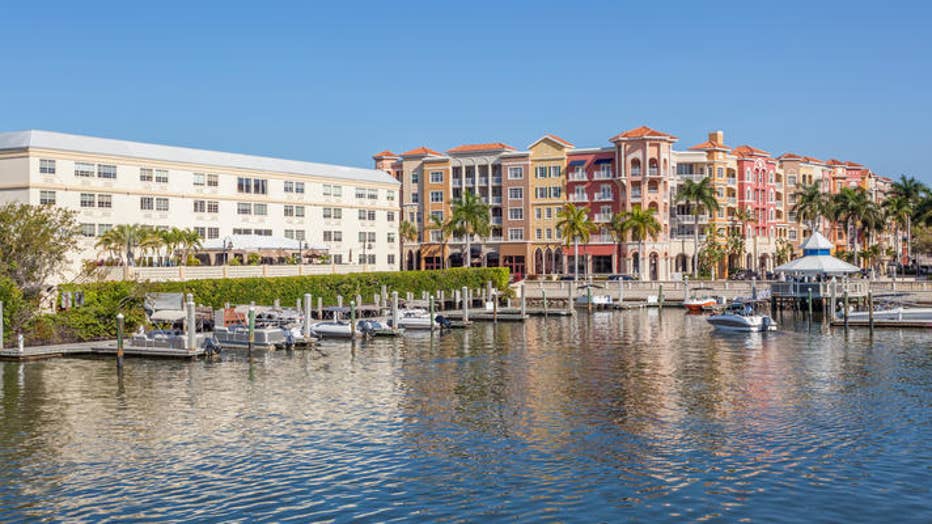
Photo Credit: philipus / Alamy Stock Photo
19. Naples-Immokalee-Marco Island, FL
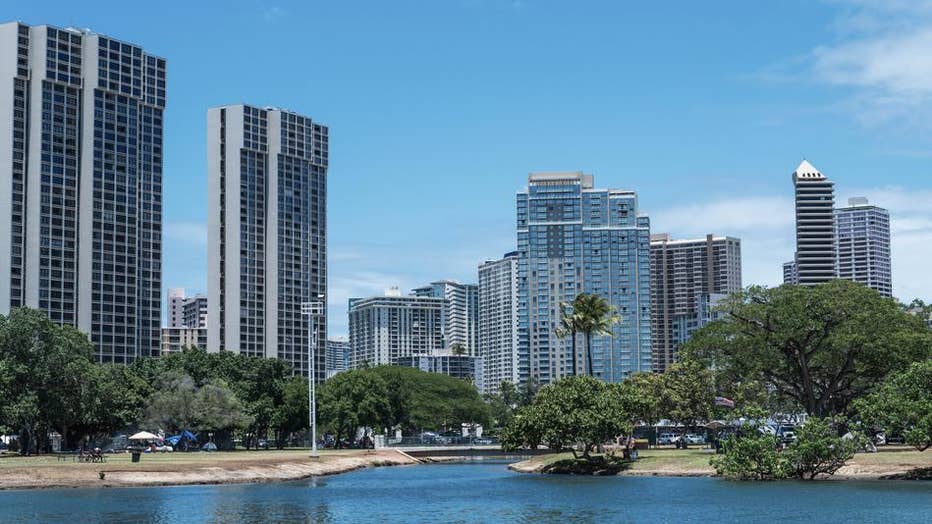
Photo Credit: Gordon Fahey / Alamy Stock Photo
18. Urban Honolulu, HI

Photo Credit: Jon Helgason / Alamy Stock Photo
17. Seattle-Tacoma-Bellevue, WA

Photo Credit: Sean Pavone / Alamy Stock Photo
16. New Orleans-Metairie, LA

Photo Credit: Sean Pavone / Alamy Stock Photo
15. Providence-Warwick, RI-MA
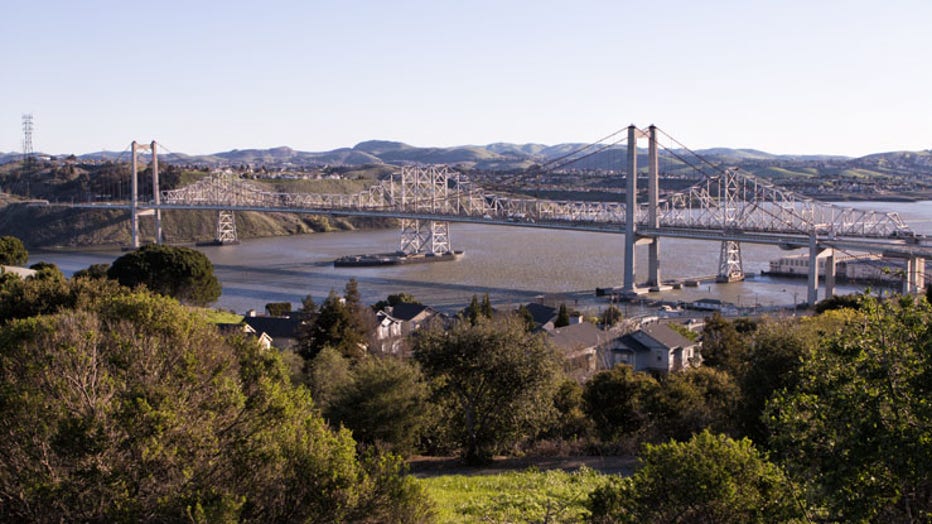
Photo Credit: Idamini / Alamy Stock Photo
14. Vallejo-Fairfield, CA
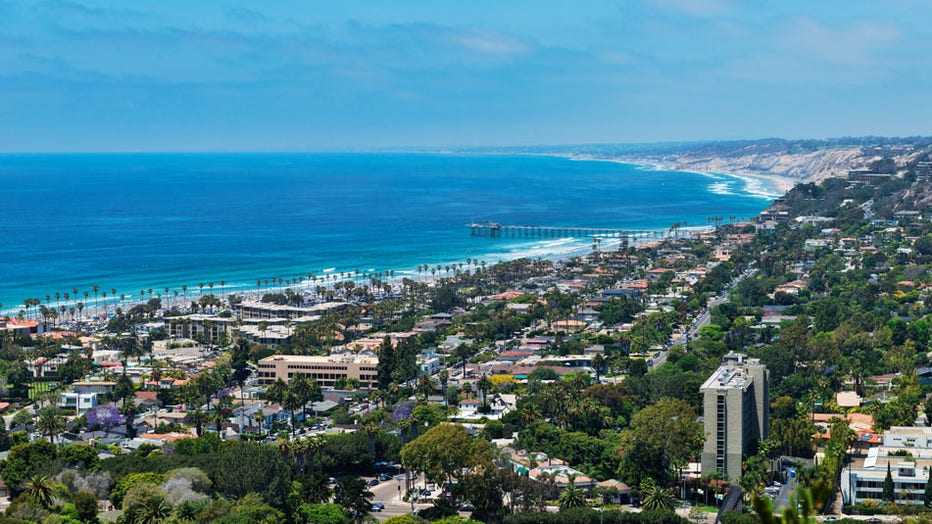
Photo Credit: Alan Crosthwaite / Alamy Stock Photo
13. San Diego-Carlsbad, CA

Photo Credit: incamerastock / Alamy Stock Photo
12. Chicago-Naperville-Elgin, IL-IN-WI

Photo Credit: trekandshoot / Alamy Stock Photo
11. Santa Rosa, CA

Photo Credit: Sean Pavone / Alamy Stock Photo
10. Nashville-Davidson–Murfreesboro–Franklin, TN

Photo Credit: Marcelo Vinante / Alamy Stock Photo
9. San Jose-Sunnyvale-Santa Clara, CA

Photo Credit: Sean Pavone / Alamy Stock Photo
8. Miami-Fort Lauderdale-West Palm Beach, FL

Photo Credit: Bennie Thornton / Alamy Stock Photo
7. Bridgeport-Stamford-Norwalk, CT

Photo Credit: incamerastock / Alamy Stock Photo
6. Oxnard-Thousand Oaks-Ventura, CA

Photo Credit: Wiliam Perry / Alamy Stock Photo
5. Santa Maria-Santa Barbara, CA
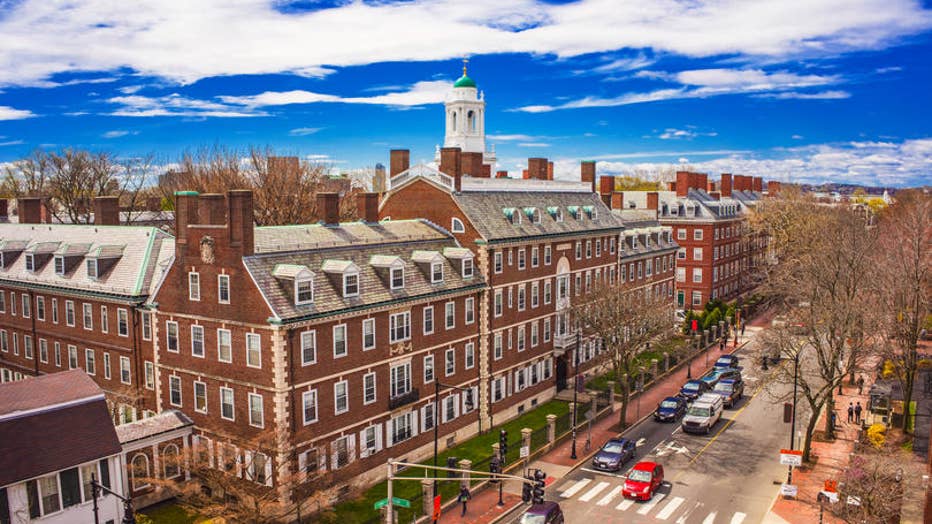
Photo Credit: Roman Babakin / Alamy Stock Photo
4. Boston-Cambridge-Newton, MA-NH

Photo Credit: Sean Pavone / Alamy Stock Photo
3. Los Angeles-Long Beach-Anaheim, CA

Photo Credit: Sean Pavone / Alamy Stock Photo
2. New York-Newark-Jersey City, NY-NJ-PA

Photo Credit: Yuval Helfman / Alamy Stock Photo
1. San Francisco-Oakland-Hayward, CA
Methodology & full results
Monthly rental prices for each metropolitan area were sourced from Zillow. The prices shown are for 1-bedroom apartments in 2017. Using Zillow rent prices, an estimate for the hourly wage needed to afford a 1-bedroom rental was calculated. For this calculation, we assumed a 40-hour workweek and that individuals would spend no more than 30 percent of gross income on rent.
To calculate the estimated hourly wage for renters, median hourly wages were sourced from the U.S. Bureau of Labor Statistics May 2017 Occupational Employment Statistics. These wages were then adjusted by the ratio of renter household income to overall household income using figures from the U.S. Census Bureau 2016 American Community Survey (ACS) 5-year Estimates. The number (and percent) of renter households was also determined using data from the 2016 American Community Survey.
The renter wage gap is the percent difference between the estimated hourly wage for renters and the hourly wage needed to pay rent. Only the largest 150 metropolitan areas were included in the analysis. The final list is ordered by renter wage gap. In the event of a tie, cities with higher hourly wages needed to pay rent were ranked higher.